historic_air_photos
Unlocking the Past: A Review of Historical Aerial and Satellite Stereo-Imagery for Geoscience Applications
![]()
abstract
Dramatic changes have occurred over the past century in many parts of the planet due to natural factors and intensifying human activities. Understanding these changes is critical for quantifying long-term environmental trends and modelling future conditions. A vast, underexploited resource for such analysis lies in historical aerial and satellite stereo imagery captured with analogue cameras from the early 1900s to the early 2000s. Originally acquired for military and mapping purposes, the stereoscopic nature of historical images offers a unique potential to reconstruct 3D Earth surface changes across the 20th century. Recent advances in photogrammetry and computer vision have greatly enhanced this potential.
Despite the early recognition of their value, these datasets remain underexploited due to challenges related to: 1) fragmented and inaccessible archives, 2) digitisation and associated costs, and 3) a lack of scalable, automated processing solutions.
This review addresses these challenges by analysing 198 studies that digitally process historical aerial and satellite stereo imagery for orthoimage and DEM generation. We provide an overview of accessed archives, processing strategies, and software pipelines. We discuss emerging tools and advanced image-matching algorithms that are improving automation and georeferencing and highlight how historical imagery can support a wide range of geoscientific applications, from climate change to urban development. Finally, we emphasise the urgent need to unlock these archives and develop efficient, reproducible workflows to preserve and exploit this irreplaceable remote sensing dataset before physical degradation or institutional neglect makes it inaccessible.
interactive map
Below is an interactive map showing the different study areas for the reviewed studies:
the dataset
This repository contains the database created as part of the review, in both SQLite and Excel Workbook formats:
The database has the following structure:
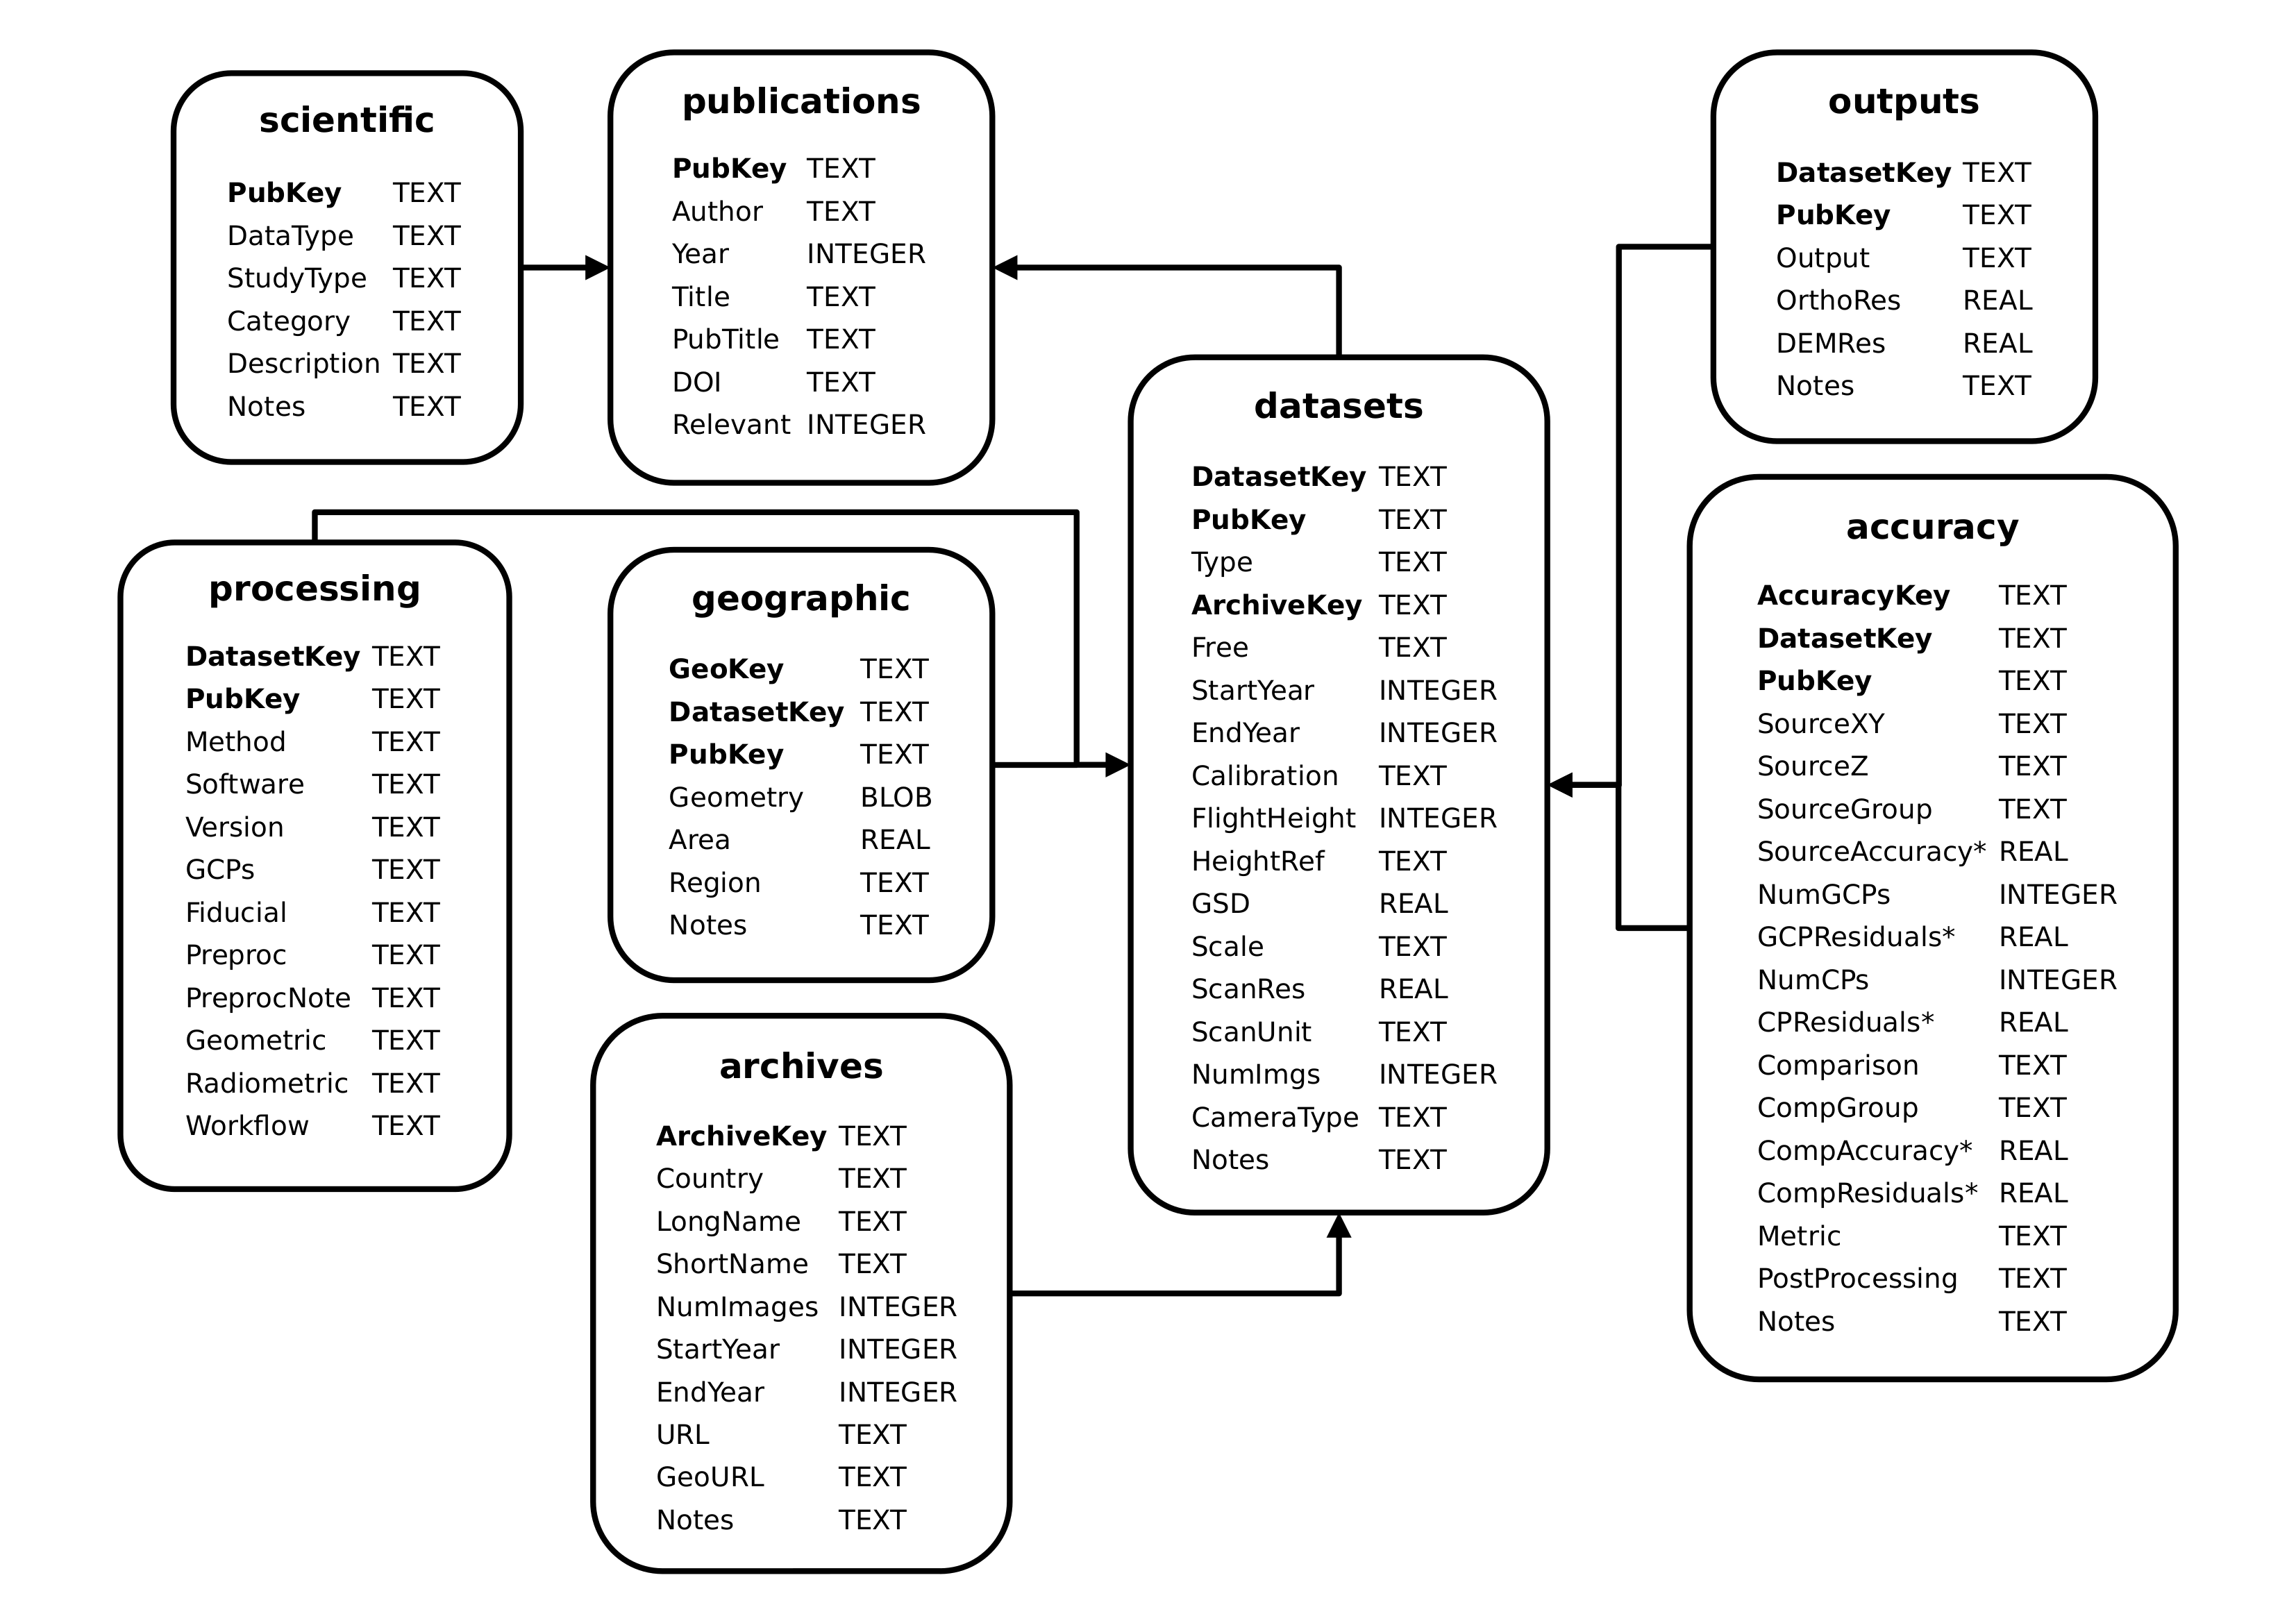 Database tables, data types, and links. Bold text indicates a key. For a complete description of each table and
field in the database, see Table A1.
Database tables, data types, and links. Bold text indicates a key. For a complete description of each table and
field in the database, see Table A1.
Each table contains the following information:
- publications - citation information about the studies reviewed, including author, year, title, publication and DOI (if available)
- scientific - general information about the studies reviewed, including the type of data used, focus of the study, and general category (e.g., geomorphology, glaciology, etc.)
- geographic - geographic information about the study areas, including bounding geometry and area (if given)
- datasets - the datasets used in each study, including the type of photograph, archive location, acquisition information, and scanning information
- processing - how the datasets were processed, including the software used, whether GCPs or fiducial markers were used, and information about any pre-processing steps
- accuracy - the reported accuracy of the processed datasets/outputs, including comparison to reference data or GCPs
- outputs - the processed outputs of each dataset, including what outputs were produced and DEM/Orthophoto resolution
- archives - the archives that provided the images used in each study, including the name and URL (if available)
Scripts for generating the figures and tables are contained in the scripts/ folder (scripts/Fig*.py), and the individual
figures and data files are found in the figures/ folder. To run the scripts, use the provided environment.yml file
to create a conda environment with the necessary python packages.
The (non-figure) scripts in the folder are:
tools.py- contains helper functions used by many of the other scripts, including for loading the data filescreate_sqlite.py- converts the .xlsx data files into a SQLite databasemake_folium_map.py- creates the interactive map shown in the frame above (or atdata/interactive_map.html)check_accuracy_reporting.py- prints a number of statistics about the percentage of studies/datasets that have various accuracy measures/metrics